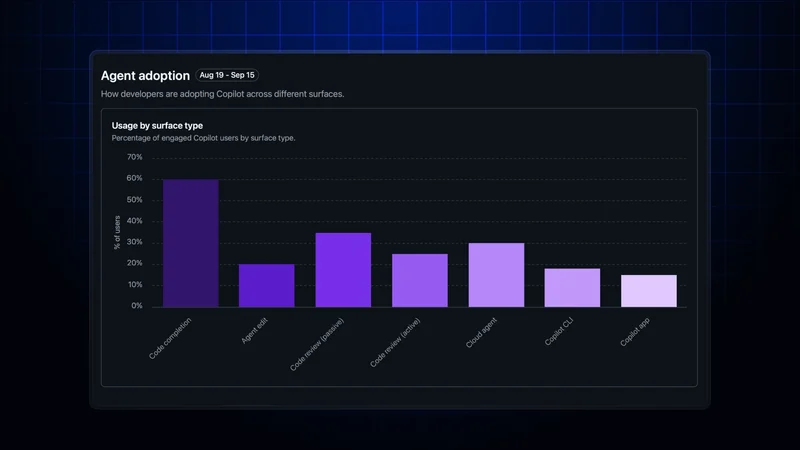
GitHub Adds Industry Comparisons to Copilot Impact Dashboard
Organizations can now measure their Copilot agentic adoption and leverage against aggregated benchmarks from participating peers.
 Radwan AbdulhadiEditor and technology writer
New Industry Comparison Feature
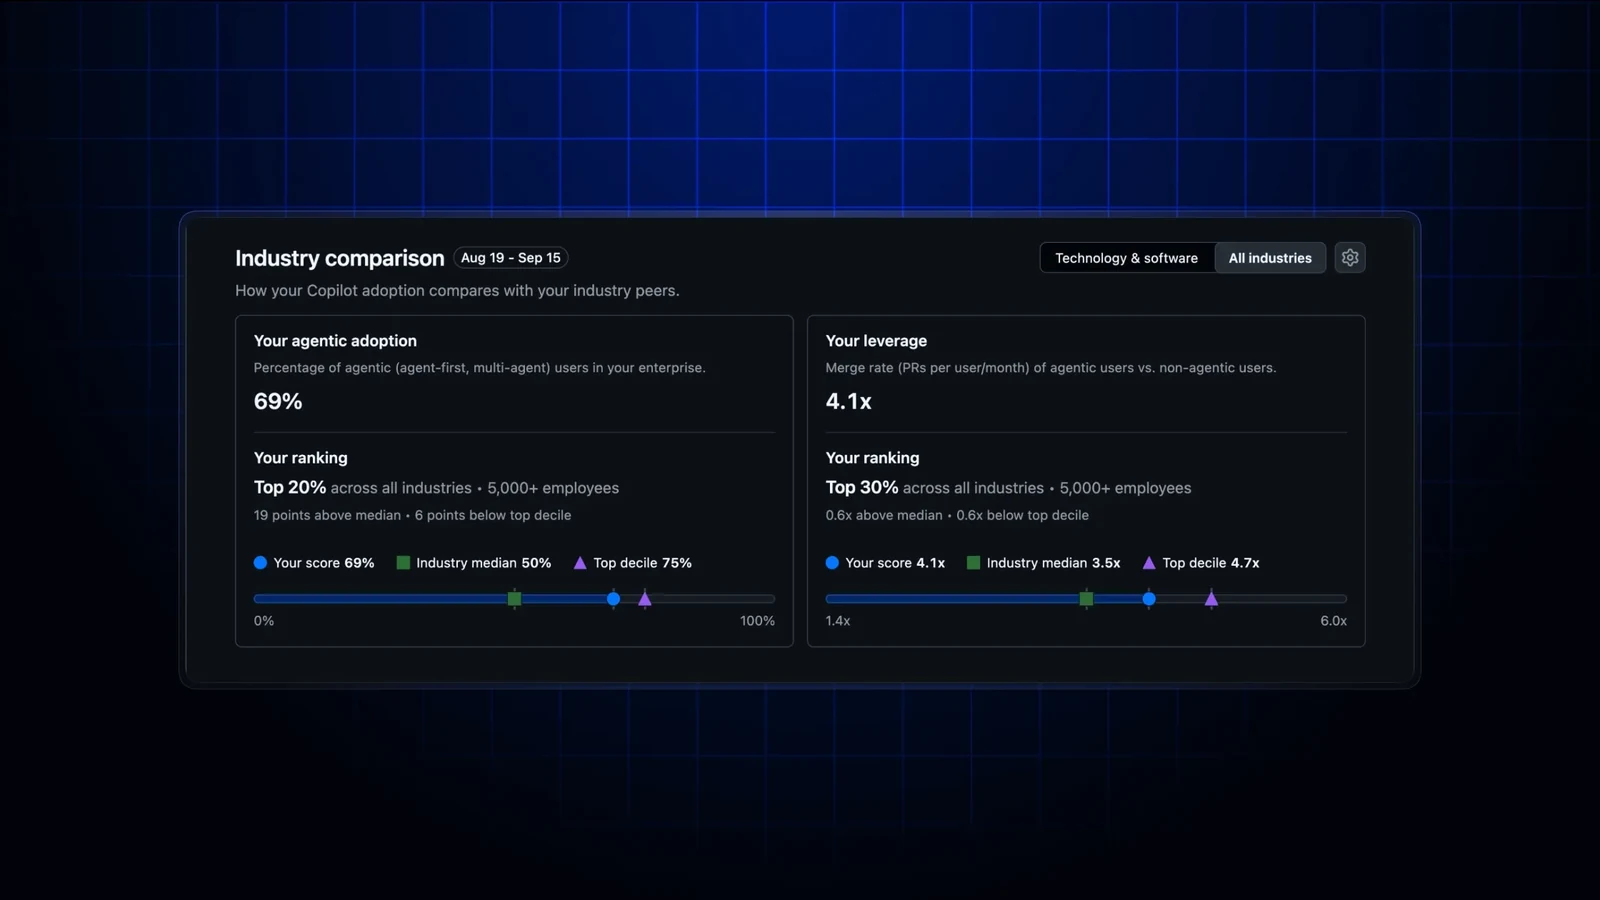
The Copilot impact dashboard now includes an “Industry comparison” section, according to an update on the [GitHub Changelog](https://github.blog/changelog/2026-10-22-industry-comparisons-in-the-copilot-impact-dashboard/). Enterprises and organizations that are not owned by an enterprise can now compare their Copilot agentic adoption and leverage metrics with aggregated benchmarks from participating peers.
Previously, enterprise leaders could measure their own Copilot adoption internally, but they lacked the external context needed to determine whether their performance was leading or lagging comparable businesses. The new industry comparisons provide the peer context required to set realistic goals, identify adoption gaps, and communicate progress effectively.
Benchmarks and Peer Groups
The platform allows administrators to view agentic adoption and leverage benchmarks, displaying the percentage of users who are agent-first or multi-agent. It also contrasts the pull request merge rate of agentic users against nonagentic users. Once enough businesses have opted in, individual scores are ranked against the peer median for the 28-day reporting period, as well as against the top decile as the peer group expands.
Users can customize their peer groups by choosing a company size—such as 1–999, 1,000–4,999, or 5,000+ employees—and selecting one of ten industries. Administrators can also toggle between their specific industry and all industries. If a specific industry peer group is too small, the dashboard automatically widens the comparison to all industries for that company size and labels the peer group used.
Opt-In Controls and Privacy
Participation in the benchmarking feature is strictly opt-in and disabled by default. Administrators can opt in directly from the dashboard or centrally via enterprise and organization Copilot policies. Both methods utilize the same underlying policy, meaning that turning it off in either location ceases both data contribution and result visibility.
For instances running on GitHub Enterprise Cloud with data residency, organizations are compared exclusively with other participants in the same region, and data is never combined across regions. Furthermore, aggregated benchmarks contain no identifying data and are automatically deleted after 30 days. When an organization opts out, comparisons halt immediately, and their data is excluded starting with the next daily update.
Availability and Limitations
Because rankings rely on sufficient participation, businesses might initially see only the median, a broader peer group than selected, or no ranking at all until more peers join. Rankings are also omitted if a user's own score cannot be calculated, such as when all users are already agent-first or multi-agent, leaving no nonagentic baseline for leverage.
Organizations owned by an enterprise participate through their parent enterprise, while enterprises used solely to assign Copilot Business licenses cannot participate. Enterprise owners and owners of independent organizations can manage opt-in settings and choose peer groups, while anyone with permission to view the dashboard can see the results, provided the Copilot usage metrics policy is enabled.
Accessing the Dashboard
It is important to note that industry comparisons appear exclusively within the dashboard interface. They are not currently included in the Copilot usage metrics API, NDJSON exports, or data downloads.
Administrators and developers looking to get started can consult the official [Copilot impact dashboard documentation](https://docs.github.com/copilot/how-tos/administer-copilot/view-impact-dashboard) for detailed instructions on navigating and configuring the new reporting features.
Sources
- GitHub ChangelogIndustry comparisons in the Copilot impact dashboard
Continue chronologically

Related entity coverage
Related stories
GitHub Adds BYOK Support to Copilot Usage API
GitHub updates its Copilot usage metrics API to separate bring-your-own-key usage and enterprise custom models from Copilot-hosted data.

GitHub Adds User Attribution and Telemetry Controls
Enterprise administrators can now attribute GitHub Copilot activity to specific users and configure fine-grained telemetry capture settings.

GitHub Copilot Expands Code Review Configurations
GitHub Copilot code review introduces general availability for personal configurations across more plans and adds enterprise-level default settings.
GitHub Adds Feature Engagement to Copilot Dashboard
GitHub’s Copilot impact dashboard now shows regular feature use, while enterprise and organization reports add 28-day engagement data.