
Cloudflare Launches Built-in Error Monitoring for Workers
Cloudflare has introduced Issues, a built-in error monitoring tool for Cloudflare Workers designed to group production failures and send context straight to coding agents.
 Radwan AbdulhadiEditor and technology writer

Introduction to Issues in Cloudflare Workers
As coding agents increasingly help developers build complex software, a major manual bottleneck remains: connecting repeated production failures to the data required to fix them. To address this workflow gap, Cloudflare announced the open beta release of Issues, a [built-in error monitoring for Cloudflare WorkersÂ] tool designed to streamline real-time detection and agent handoffs.
The new feature eliminates the need for separate SDK installations or application wrappers. Because it is embedded directly into the Worker runtime, developers can enable the system [With one line of configuration] to start monitoring uncaught exceptions, failed invocations, HTTP 5xx responses, console outputs, and stack traces without additional instrumentation.
Streamlining Diagnostics and Grouping Failures
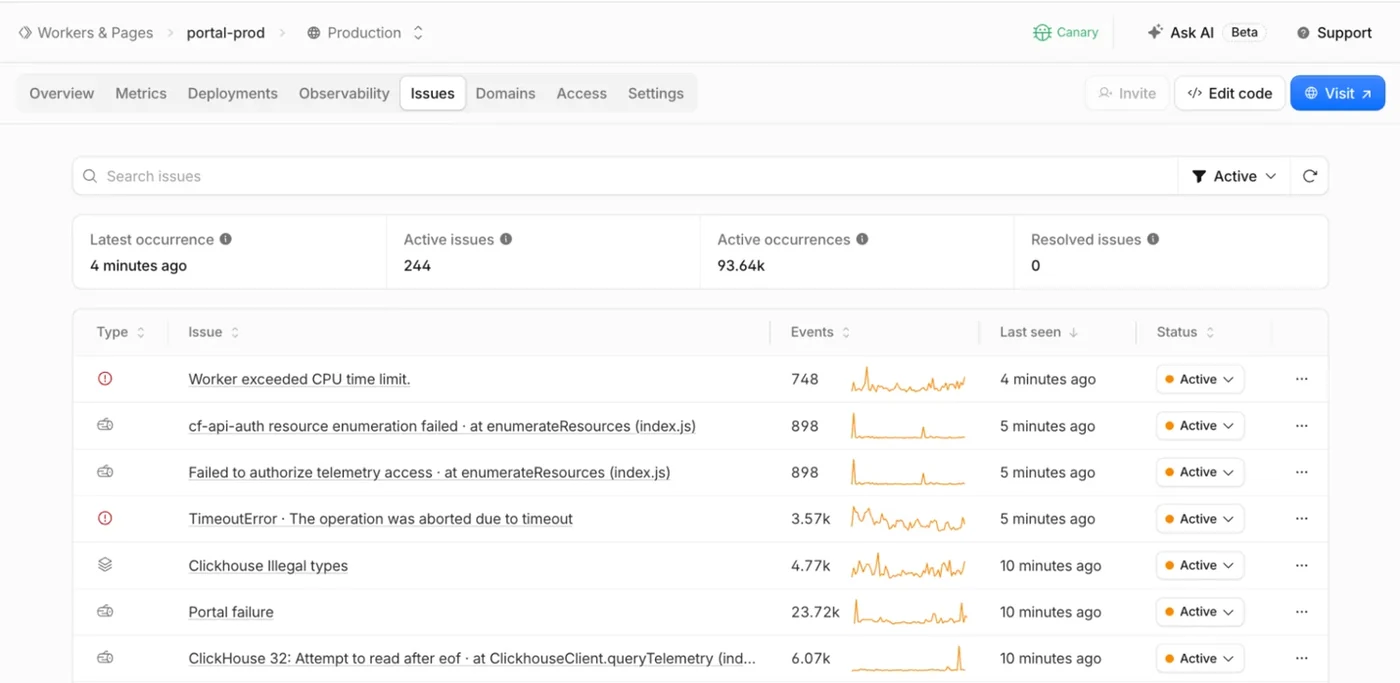
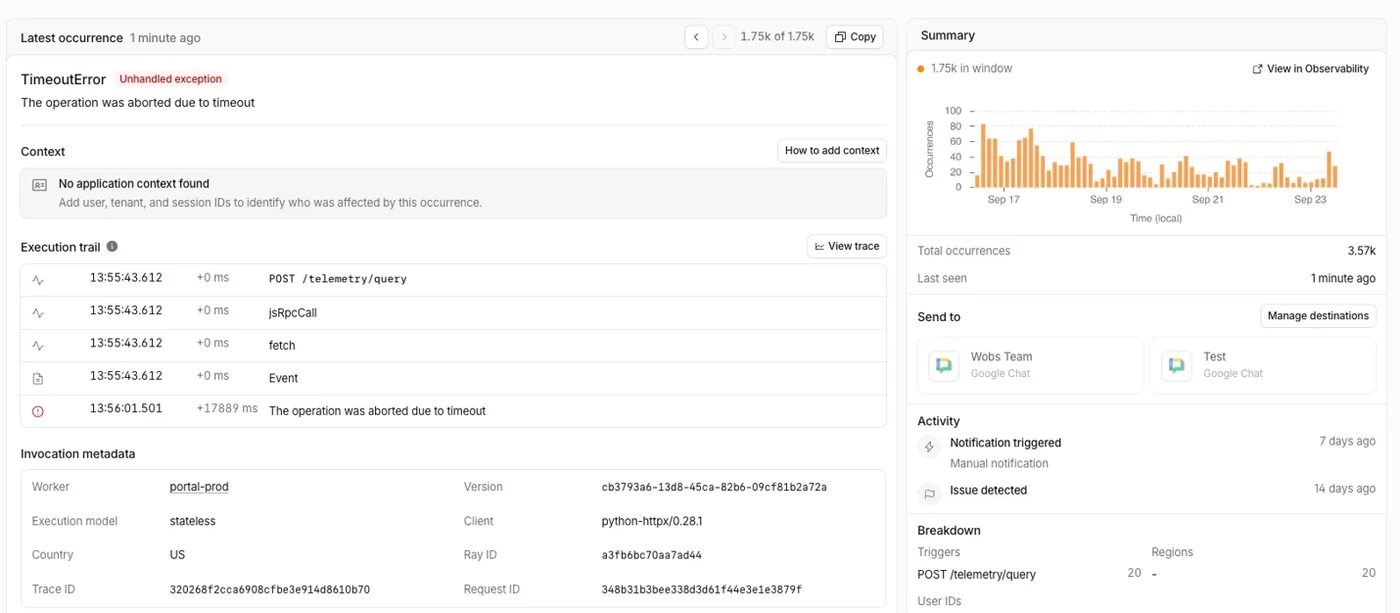
Production applications often generate thousands of separate failure logs stemming from a single underlying bug. Issues automatically groups repeated exceptions, error logs, and 5xx responses into a unified issue tracker. It highlights metrics such as when an error first appeared, how frequently it occurs, and whether the error rate is accelerating.
While Cloudflare automatically captures runtime behavior, developers can also incorporate custom application context. By leveraging the [Worker runtime's] built-in OpenTelemetry API, teams can [add those identifiers]—such as specific users, accounts, or sessions—directly to error occurrences without installing extra packages.
Automated Handoffs to Coding Agents
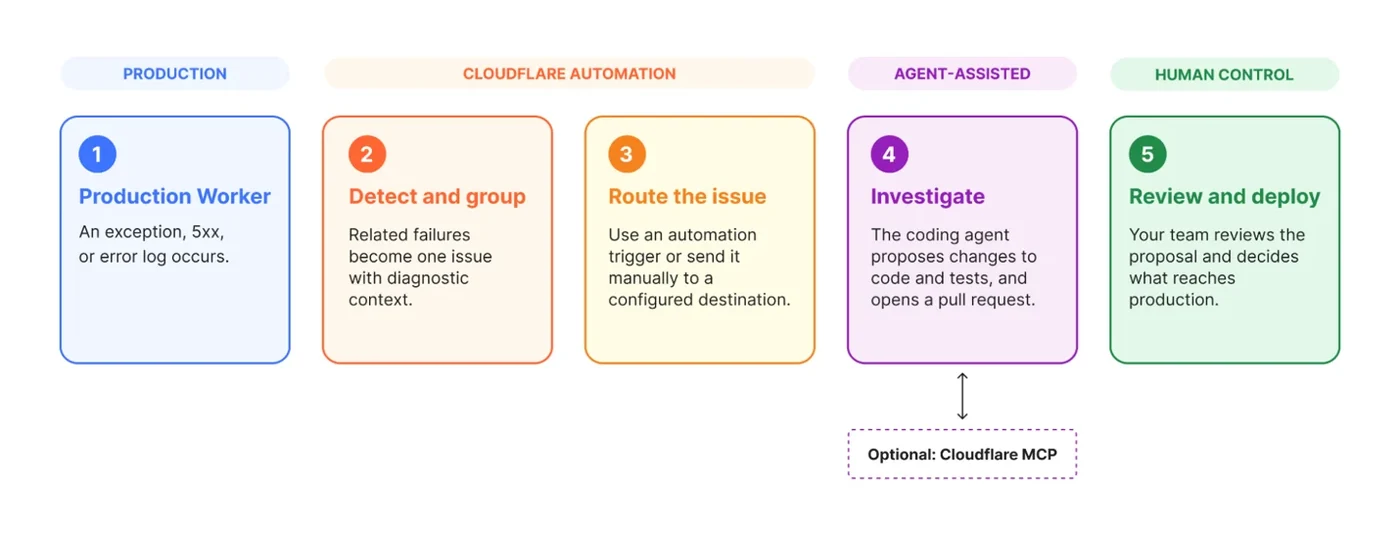
Instead of requiring human operators to manually copy stack traces into local prompts, [Automations] allow teams to configure direct delivery channels. Once an issue crosses specified occurrence thresholds or returns after a quiet period, the system forwards the diagnostic payload directly to designated coding agents or endpoint destinations.
Supported direct integrations include [Claude Code] routines, [Cursor] automation webhook triggers, generic HTTPS webhooks, and incident management notification platforms. Once the agent receives the structured context, it can investigate the repository, propose code changes, and open a pull request for review.
Real-World Testing on Cloudflare Workflows
Cloudflare tested the new error monitoring capability internally on its own production systems powering Cloudflare Workflows. Within a single day of enabling the feature, internal teams successfully uncovered and resolved two complex bugs that were previously hidden beneath large volumes of traffic.
The first bug involved a Workflows control plane migration getting stuck in a retry loop due to a SQLite foreign key error in an edge case. The second bug involved Workflow instance deletions occasionally exceeding subrequest limits and failing to finish. In both instances, the monitoring system routed the telemetry directly to internal agents to propose successful code fixes.
Getting Started With Issues
Developers looking to test the open beta can begin by setting observability.issues.enabled to true inside their wrangler.jsonc configuration file. Additional rules and automated delivery channels can be established directly through the Cloudflare dashboard.
For agent-driven setups or command-line workflows, developers can also utilize the [CF CLI] to inspect issues and build automations. Comprehensive setup guidelines and technical requirements are available directly in the official [documentation].
Sources
- Cloudflare BlogDetect and send production issues straight to your agent