
Cloudflare Introduces Production CPU and Memory Profiling
Cloudflare has launched on-demand CPU and memory profiling for Cloudflare Workers and Durable Objects, bringing interactive flamegraphs directly into production environments to help developers trace performance bottlenecks and memory leaks.
 Radwan AbdulhadiEditor and technology writer
On-Demand Production Profiling Released
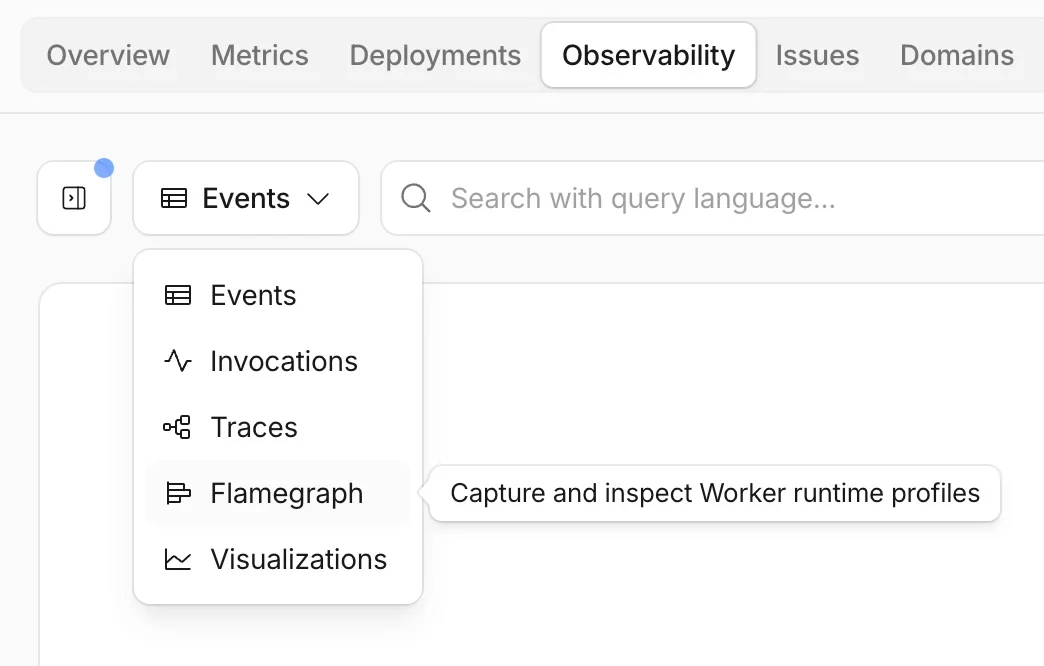
Understanding why an application consumes more resources than expected, whether through high CPU utilization or excessive memory usage, can pose significant challenges during development. Traditional methods such as standard logs and aggregate metrics only provide limited visibility. To solve this limitation, Cloudflare has announced support for CPU and memory profiling of Workers and Durable Objects. Developers can now request an on-demand CPU or memory profile of an active Worker directly from the Observability page, inspect the data using an interactive flamegraph, and download the raw profile file for deeper offline analysis.
Profiling applications in real-world settings is widely regarded as the most effective method for understanding live code behavior because local debugging environments cannot replicate production traffic patterns. While local profiling through Chrome DevTools has been supported previously, it lacked the volume and variety of live user traffic. Because Workers replicate across different data centers and physical hardware to serve requests nearest to clients, capturing production data provides an accurate view of performance.

How to Capture Profiles via CLI and Dashboard
To capture performance profiles on active Workers, developers can choose between using the command-line interface or the web interface. To use the command line, make sure that you have the cf package installed before executing the profiling commands. Selecting a version with sufficient traffic is critical, as active execution requires adequate request volume to generate meaningful tracing data.
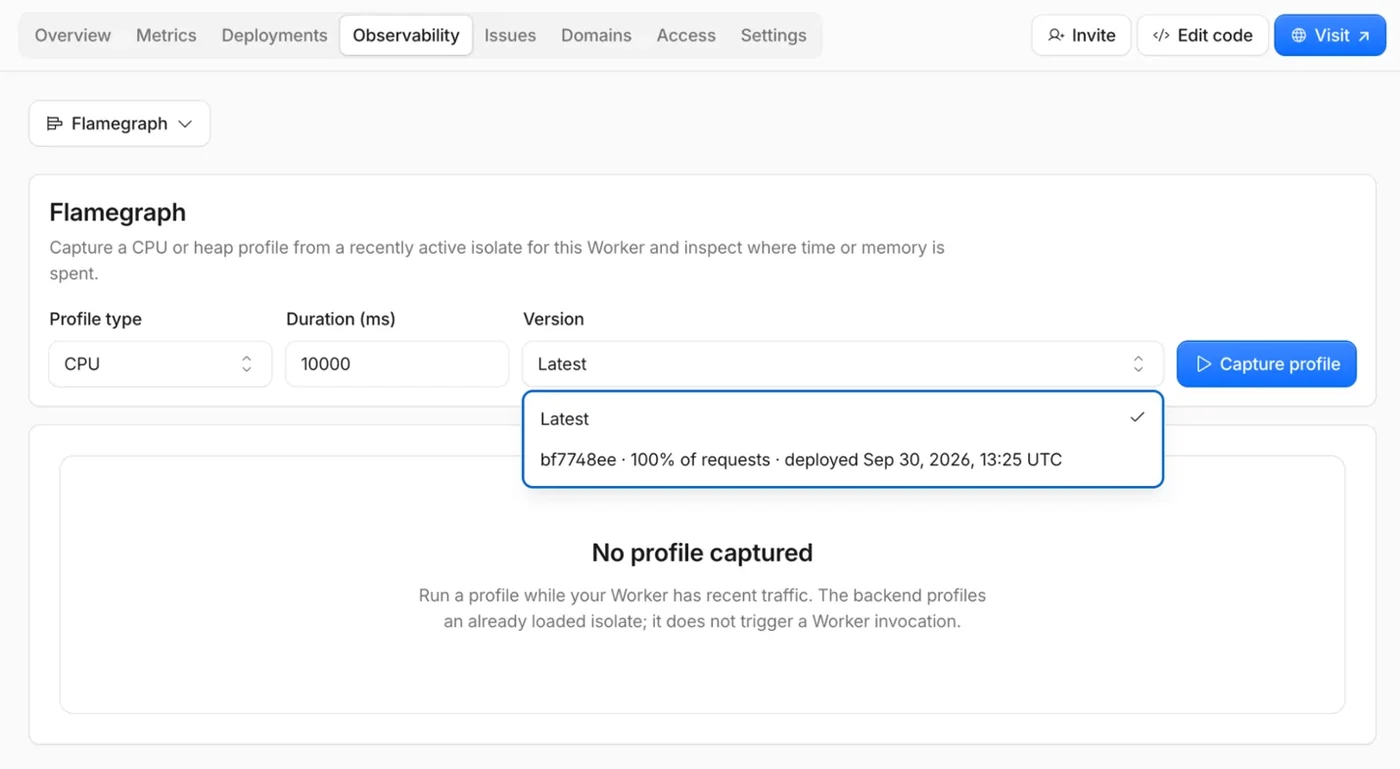
Alternatively, users can navigate through the Cloudflare dashboard by accessing the account list of Workers via the Build, Compute, and Workers & Pages navigation menus. Selecting a specific Worker and opening its Observability tab allows users to select the flamegraph option from the dropdown menu. Users can define the trace duration, target specific application versions, and trigger the capture profile button to render the resulting visual representation.
Projects built using TypeScript require proper configuration to ensure function names display clearly during analysis. Developers should make sure that you have source maps enabled for your project to avoid seeing obfuscated function identifiers within the generated flamegraphs. Detailed guidance and workflow steps are outlined in the official developer documentation.
Interpreting Flamegraphs and Table Views
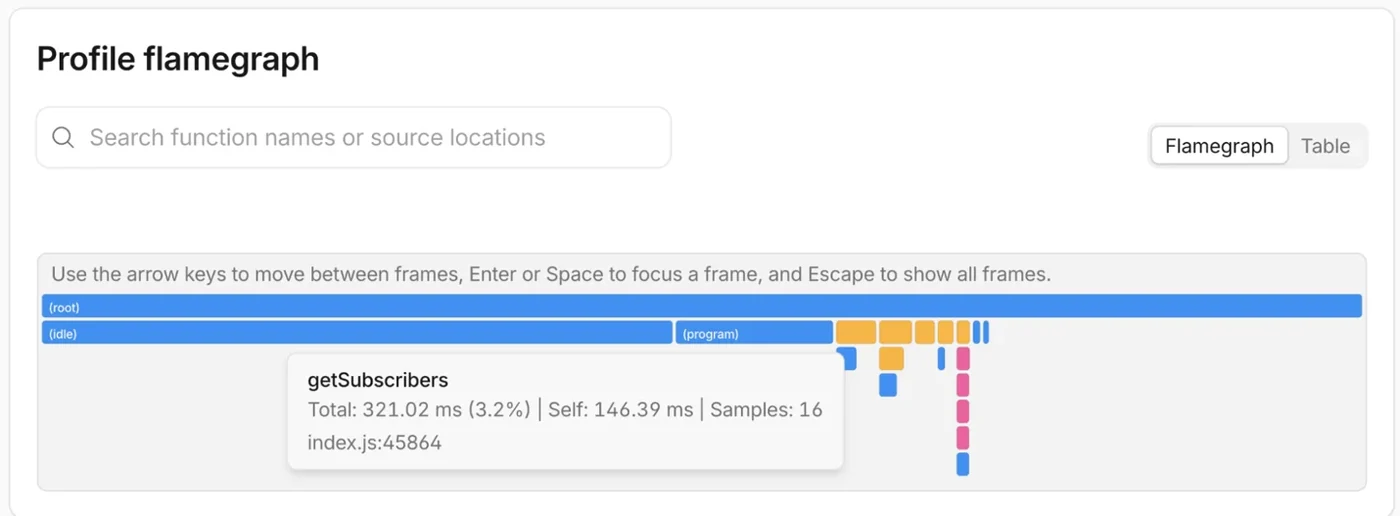
Once the profiler completes its configured run duration, an interactive flamegraph visualizes the performance profile. Each rectangular block in the interface corresponds to an individual function call. The horizontal width of each rectangle indicates the proportional amount of CPU time or memory allocated and utilized by that specific function. Developers can click individual function blocks to focus analysis or hover over them to review detailed execution metrics.
In addition to visual flamegraphs, engineers can utilize a table view to quickly identify which functions appear most frequently across profile samples. Capturing multiple profiles and inspecting the widest graphical blocks helps pinpoint resource-heavy functions. Internal teams at Cloudflare utilized these insights to optimize CPU efficiency, resolve out-of-memory errors, and eliminate hidden performance bottlenecks in production services.
Real-World CPU Optimization Case Study
Cloudflare engineers applied the new profiling tools to the Worker implementation handling the R2 binding, which processes substantial production traffic. Capturing a 50-second CPU trace revealed broad execution blocks such as decryptBlock for object decryption and fillResponse for byte manipulation, both of which represented unavoidable core operations.
Switching to the table view and sorting by sample frequency highlighted a function named genericR2JsonReplacer, which accounted for over five percent of total CPU time. Investigation showed that JSON.stringify called the replacer on every node while the replacer independently walked the tree structure, causing duplicate recursive processing on deeply nested values. Eliminating this redundant traversal made the genericR2JsonReplacer function 2.7 times faster. Another optimization involved caching a heavy metrics function call that consumed one percent of CPU time per invocation, saving additional processing cycles.
Resolving Memory Leaks and Evictions
Internal teams also addressed a persistent memory issue where a Worker experienced frequent evictions due to Exceeded Memory errors, running near the 128 MB limit with P999 memory hovering around 133 MB. While aggregate error metrics indicated memory exhaustion, they failed to identify the specific code responsible.
By taking a heap profile of the production Worker and analyzing it with pprof, engineers discovered that Prometheus monitoring code accounted for roughly 66.7 percent of all memory allocations. Although developers believed this code was disabled, it remained partially active and instrumented multiple code paths without exporting data. Removing the Prometheus code path completely lowered memory usage, providing approximately 10 MB of safe headroom below the 128 MB limit and eliminating the memory errors.
Sources
- Cloudflare BlogIntroducing on-demand CPU and memory profiling with flamegraphs for Workers and Durable Objects
Continue chronologically


Related entity coverage
Related stories
Cloudflare Brings Programmability to Gateway and DLP
Cloudflare introduces a fully programmable secure web gateway and data loss prevention platform by integrating Cloudflare Workers at the network edge.

Cloudflare Launches Built-in Error Monitoring for Workers
Cloudflare has introduced Issues, a built-in error monitoring tool for Cloudflare Workers that connects production failures directly to coding agents.

Cloudflare Launches Worker Previews for Isolated Environments
Cloudflare introduces Worker Previews, providing developers and AI agents with isolated, production-like environments for testing code changes in parallel.

Cloudflare Launches Eight Major Observability Updates
Cloudflare has introduced eight major updates combining logs, traces, analytics, alerts, dashboards, querying, and telemetry export into one platform.