
Cloudflare Launches Eight Major Observability Updates
Cloudflare is rolling out eight major updates designed to unify logs, traces, analytics, alerts, dashboards, querying, and telemetry export into a single observability platform with simpler pricing.
 Radwan AbdulhadiEditor and technology writer
Unifying Platform Signals
Cloudflare has announced the launch of eight major updates intended to bring logs, traces, analytics, alerts, dashboards, and exporting capabilities into one centralized observability platform, supported by simpler and more predictable pricing. According to the company, investigating issues historically required navigating multiple distinct products to find where specific signals originated, such as separating Worker behaviors from global origin connection failures. To address this friction, the company is deploying a shared observability platform that integrates logs, analytics, and exporting tools across its entire ecosystem, as detailed on the Cloudflare Blog.
The platform changes aim to reflect how modern applications actually behave by giving engineering teams comprehensive context during incident investigations. Over the coming months, additional datasets and workflows are expected to join the shared platform to maintain consistent pricing and product experiences. These updates serve as an initial step toward a unified observability architecture that consolidates investigative tools for developers and system administrators alike.
Streamlining Logs and Tracing
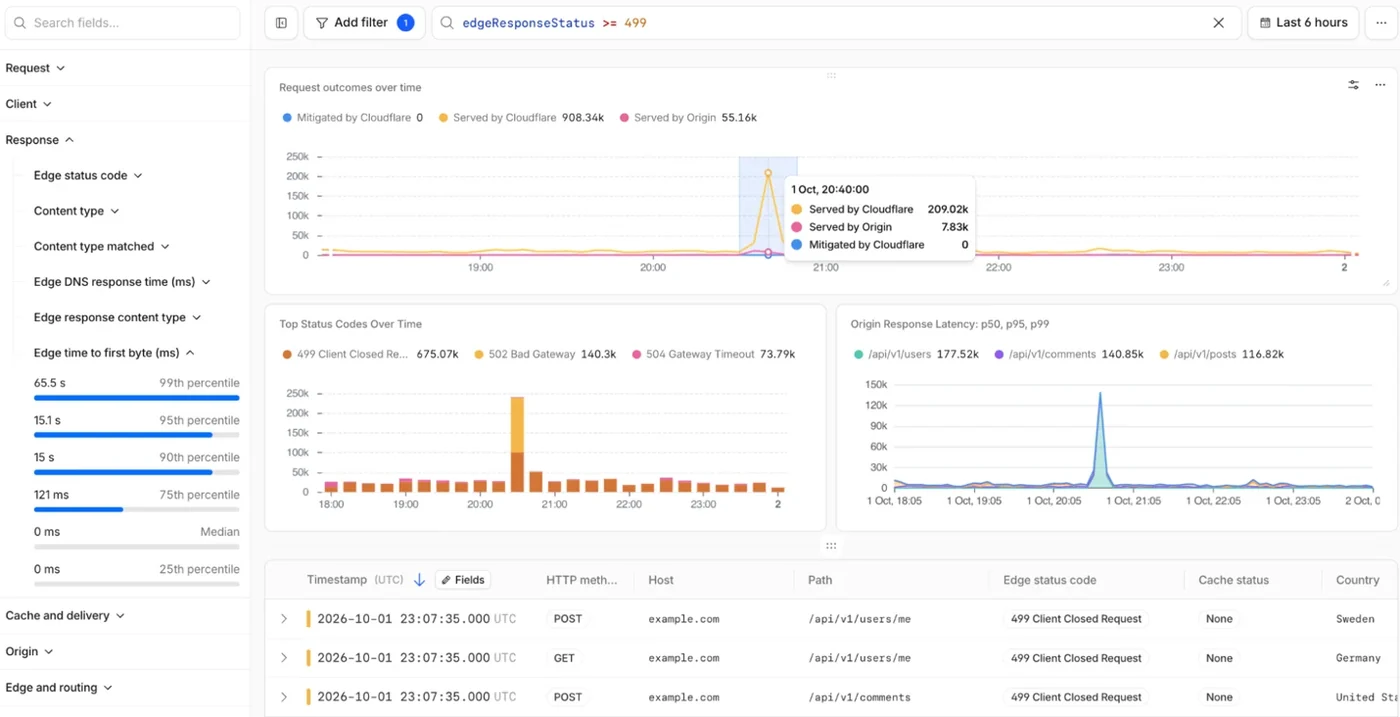
As part of the rollout, the new Logs home combines Workers Observability for debugging applications with Log Explorer for searching security logs. Users can select from various log datasets—including HTTP events, firewall events, Workers, Containers, R2, and AI Gateway—and investigate them using unified tools. Investigators can isolate request latency increases, group results by hostname or data center, filter down to affected paths, and inspect individual requests via Ray ID without switching between disconnected interfaces.
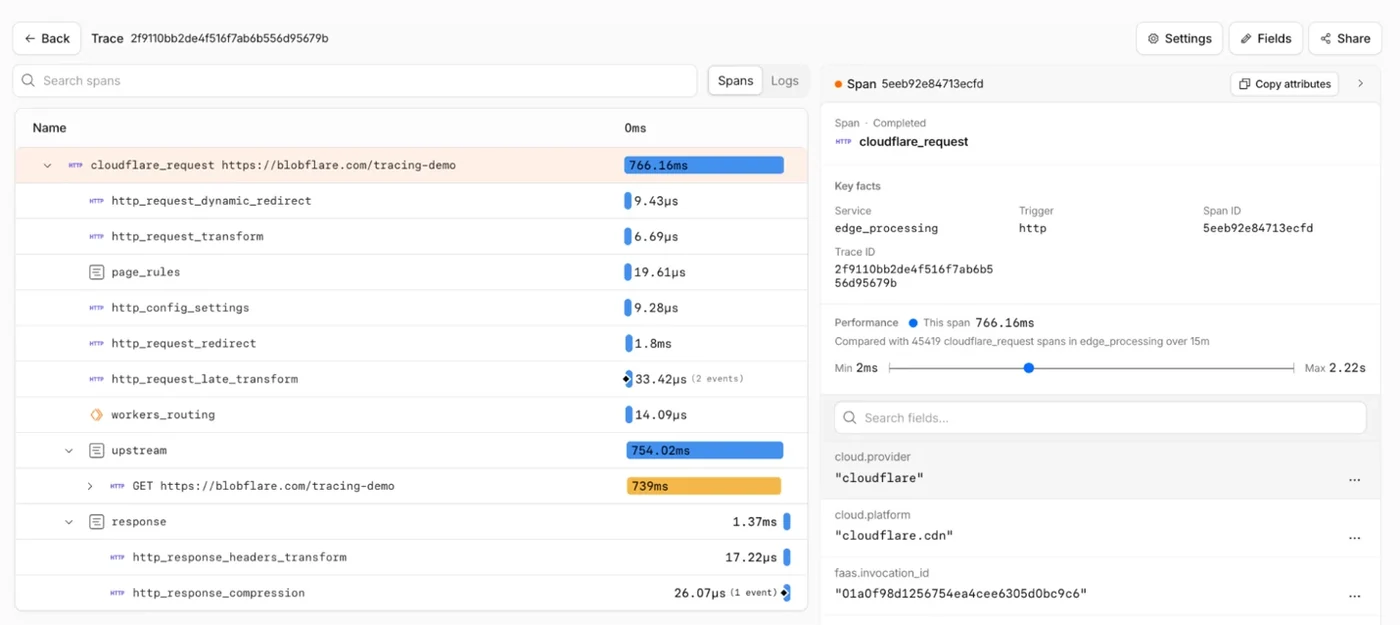
In parallel, Cloudflare Traces has debuted in open beta to provide a request-level view spanning supported security rules, transformations, cache decisions, routing, Workers, and origin handling. Teams can establish a baseline sampling rate for continuous visibility or deploy Trace Rules to capture specific traffic streams during active investigations. Furthermore, traces can be exported using OpenTelemetry while supporting W3C trace context propagation for seamless integration with origin servers.
Unified SQL API and Agent Queries
To help automated systems and human operators sift through telemetry data more efficiently, Cloudflare is launching a unified SQL API in beta. Rather than integrating separately with Workers logs, Containers security events, HTTP request logs, and analytics data, users and AI agents can query all datasets using a single SQL dialect, authentication model, and API endpoint. Agents can interact with the system using the new Cloudflare CLI or connect via the Observability MCP server.
The platform also integrates native SQL capabilities directly into Workers. This allows developers to query Analytics Engine data directly from their Worker applications to meter customer usage, power billing workflows, build analytics dashboards, generate health reports, and automate incident investigations without configuring separate API clients.
Predictable Pricing and Custom Alerts
Cloudflare is shifting all ingested and stored logs and traces to a unified observability subscription model. Beginning December 1, 2026, the updated pricing model will apply across all plans—becoming effective upon renewal for Enterprise customers—covering existing Developer Platform logs like Workers, Containers, AI Gateway, and tracing data. The pricing structure is based strictly on ingested and stored volumes rather than event counts, charging $0.25 per GB ingested and $0.10 per GB-month stored, with an allocation of 50 GB of ingestion and 10 GB-month of storage per billing cycle.
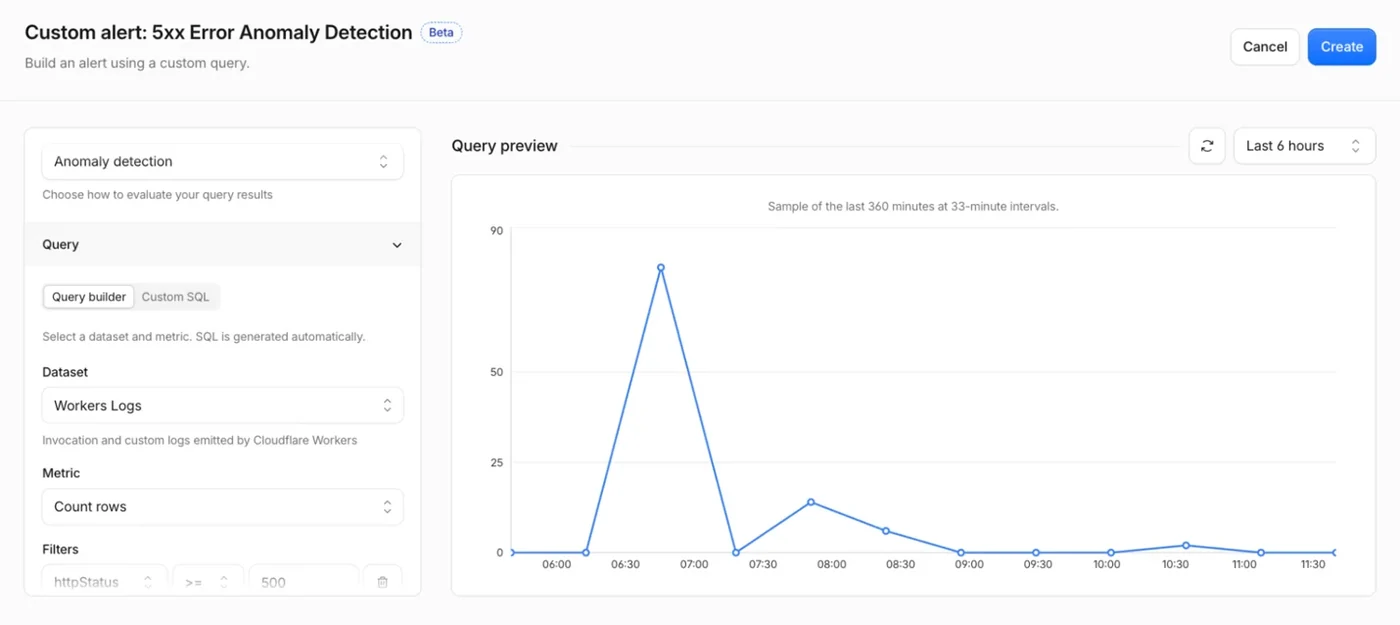
Additionally, notification systems have been upgraded into customizable alerts capable of monitoring any metric supported by the new unified SQL API. Teams can define alerts using custom SQL conditions, set evaluation windows, and route notifications to incident management tools, chat platforms, and webhooks. Webhooks are now available across all plans, enabling customized alerting pipelines and automated agent responses.
Sources
- Cloudflare Blog8 major updates to Cloudflare Observability
Continue chronologically

Related entity coverage
Related stories
Cloudflare Launches Traces in Open Beta for End-to-End Request Visibility
Cloudflare has introduced Cloudflare Traces in open beta, extending automated request tracing across security rules, caches, Workers, and origin infrastructure.

GitHub Copilot App Adds OpenTelemetry Support
The GitHub Copilot app now supports OpenTelemetry configuration via enterprise-managed settings, letting organizations track agent activity and performance.
Cloudflare Introduces Web Search API via AI Gateway
Cloudflare has announced native web search API integration for AI Gateway in partnership with Ceramic.ai, Exa, and Linkup for real-time model context.

Cloudflare Updates Kitesurf Browser With WebMCP And Terminal Rendering
Cloudflare has updated its Kitesurf browser for AI agents with WebMCP support, enhanced DOM performance, and terminal-based rendering capabilities.