
Cloudflare Open Sources BEACON Web Performance Dataset
Cloudflare is publishing the BEACON dataset to provide unprecedented visibility into how real people experience the web across different browsers, devices, and countries.
 Radwan AbdulhadiEditor and technology writer

Bridging the Perception Gap in Web Development
Technology professionals frequently develop software using powerful flagship devices connected to robust, high-speed networks. However, this environment is often far removed from the daily reality experienced by end users worldwide who may rely on budget hardware, throttled data plans, or under-invested public infrastructure.
To help close this perception gap using objective data, Cloudflare has introduced the BEACON dataset, which stands for Browser Experience Across Cloudflare's Observed Network. The initiative makes billions of anonymized performance measurements publicly available [on Google BigQuery](https://console.cloud.google.com/bigquery?ws=!1m4!1m3!3m2!1scf-open-web-performance!2srumarchive).
By sharing this information, Cloudflare aims to provide a clear view of how real users experience websites, supporting the broader goal of building an internet that is fast and accessible for everyone regardless of hardware limitations.

Dataset Scope and Core Web Vitals
BEACON compiles anonymized telemetry collected from 10,000 of the largest websites on Cloudflare's network. The dataset spans every major browser engine and is updated daily, utilizing standards defined by the community-led [RUM Archive](https://rumarchive.com/).
By expanding the footprint of the original project 100-fold, BEACON offers researchers detailed visibility into web performance across different countries and devices. Rather than relying solely on traditional single averages like the 75th percentile, the dataset publishes full histograms for Core Web Vitals such as Cumulative Layout Shift and Interaction to Next Paint.
These full histograms enable developers and researchers to analyze the long tail of performance data, exposing where the technology industry still struggles to deliver fast experiences to all users.
Browser Engine Comparisons and Industry Classifications
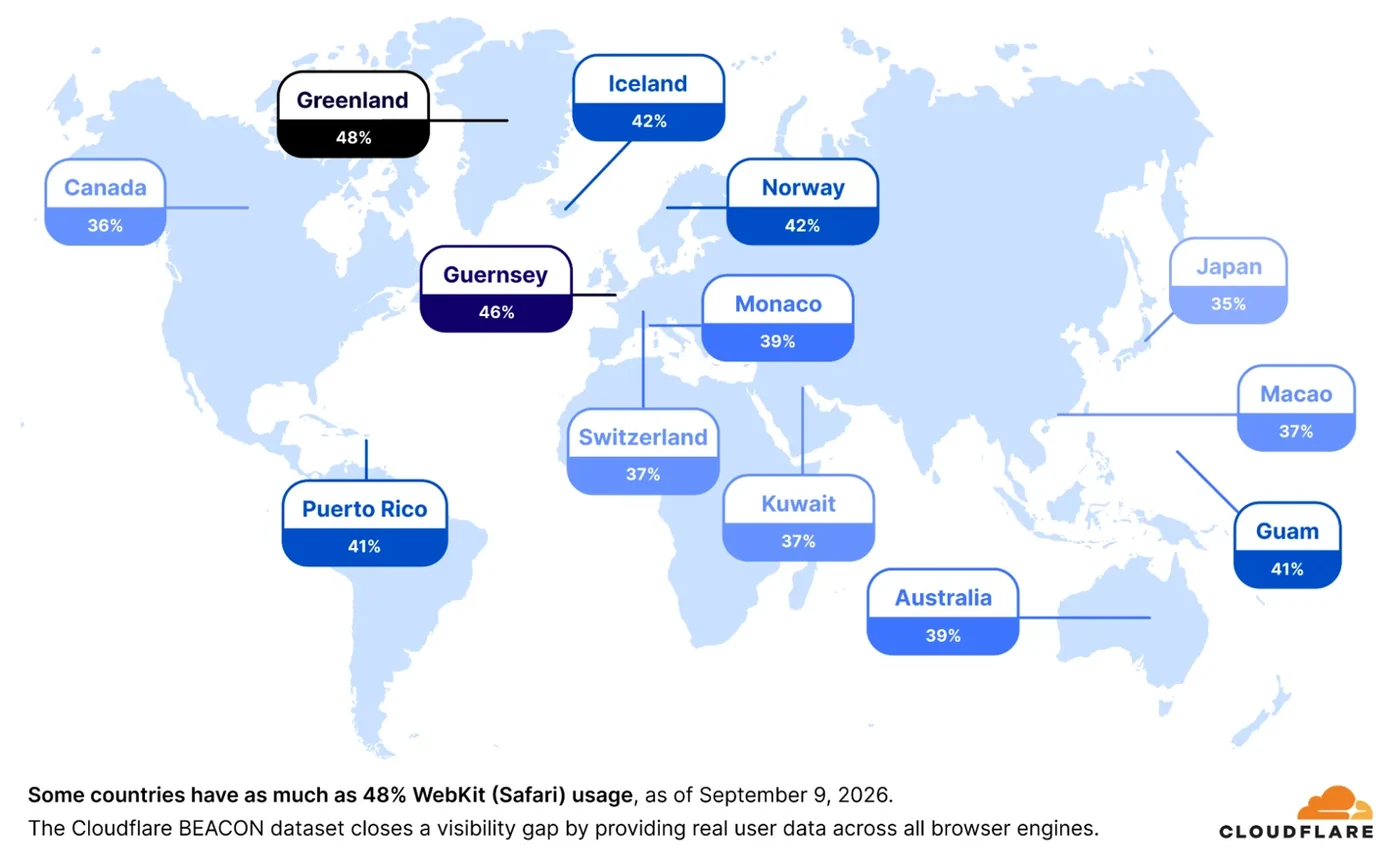
Analysis of the BEACON dataset reveals nuanced performance trends across different browser engines. While WebKit generally performs strongly on key metrics, that advantage is not universal across all regions. In 46 countries where WebKit accounts for more than 10% of traffic, its Largest Contentful Paint or Interaction to Next Paint metrics can lag behind Blink-based browsers by significant margins.
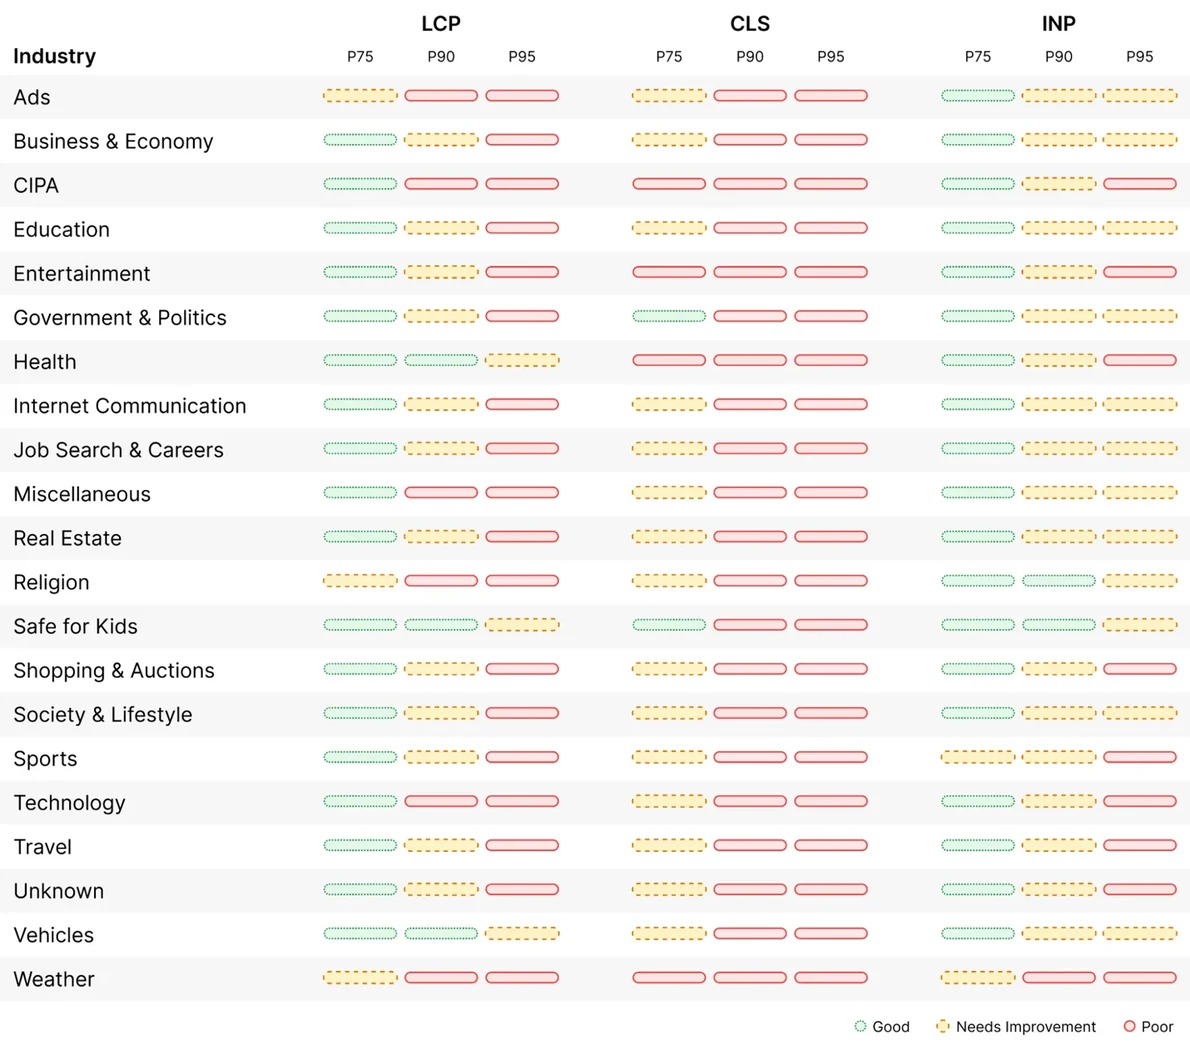
In addition to browser telemetry, the dataset integrates domain industry classifications sourced from [our Intel API](https://developers.cloudflare.com/api/resources/intel/subresources/domains/subresources/bulks/methods/get/). These categories highlight that government, health, and child-safe sites typically achieve high performance, whereas categories like ads, religion, and weather often record slower loading metrics.
Cloudflare customers can leverage specific tools to optimize resource delivery. For instance, features like [Smart Hints](https://blog.cloudflare.com/smart-hints/) help address certain resource-discovery delays that impact page loading times.
Sub-Metrics and Third-Party JavaScript Impact
BEACON extends standard monitoring by breaking down Largest Contentful Paint and Interaction to Next Paint into distinct sub-parts, separating the individual stages of loading and response handling. For responsiveness, the data tracks input delay, processing time, and presentation delay.
The findings challenge the assumption that downloading heavy resources like images or videos is always the primary bottleneck. Instead, discovering the loading candidate and unblocking its render often present larger optimization opportunities.
For interactions experiencing significant delays, JavaScript execution and complex CSS layout recalculations drive up presentation time. Cloudflare customers can mitigate some of these performance impacts from third-party scripts by utilizing products such as [Zaraz](https://www.cloudflare.com/en-in/application-services/products/zaraz/).
Application Architecture and Soft Navigations
Modern application architectures also shape overall web performance trends. Cloudflare recently [added support for Google Chrome’s new Soft Navigations API](https://developers.cloudflare.com/changelog/post/2026-08-21-improved-soft-navigation-measurement-for-single-page-applications/), which accurately reports metrics for client-side navigations common in single-page applications built using frameworks like React, Vue, Angular, and Svelte.
Data tracked in BigQuery indicates that soft navigations render significantly faster than hard navigations across all percentiles. However, development teams must carefully weigh tradeoffs because initial landing pages under this architecture are often considerably heavier.
If users rarely navigate beyond the initial view, the cost of a heavier initial load may outweigh the performance gains of subsequent client-side transitions.
Combining Data Sources for Broader Insights
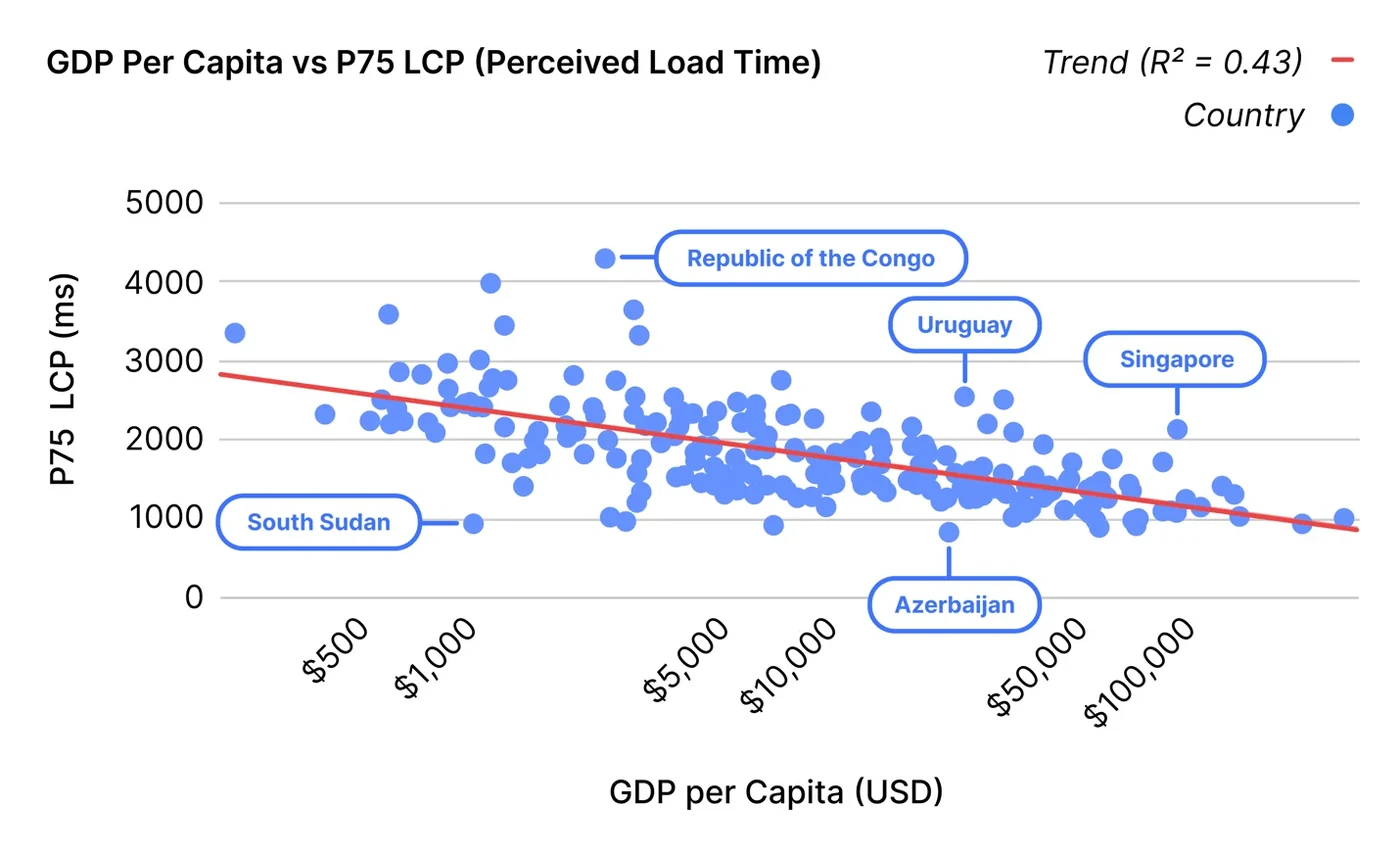
Because BEACON is an open dataset, its utility extends beyond its internal fields. Researchers can cross-reference the data with external benchmarks, such as the [World Bank Group’s measure of GDP per capita](https://data.worldbank.org/indicator/NY.GDP.PCAP.KN), to analyze how macroeconomic conditions correlate with web performance across different nations.
In addition, [Cloudflare Radar](https://radar.cloudflare.com/) will incorporate these performance metrics into a dedicated web performance section, featuring correlations between its Internet Quality Index data and the new BEACON dataset.
Sources
- Cloudflare BlogHow fast is the web? Explore billions of real-user measurements with BEACON