
Amazon QuickSight Introduces New Hierarchy Filter Feature
Amazon QuickSight has announced the rollout of a new hierarchy filter feature designed to simplify dashboard drill-downs and reduce interface clutter for users.
 Radwan AbdulhadiEditor and technology writer
Streamlining Dashboard Navigation
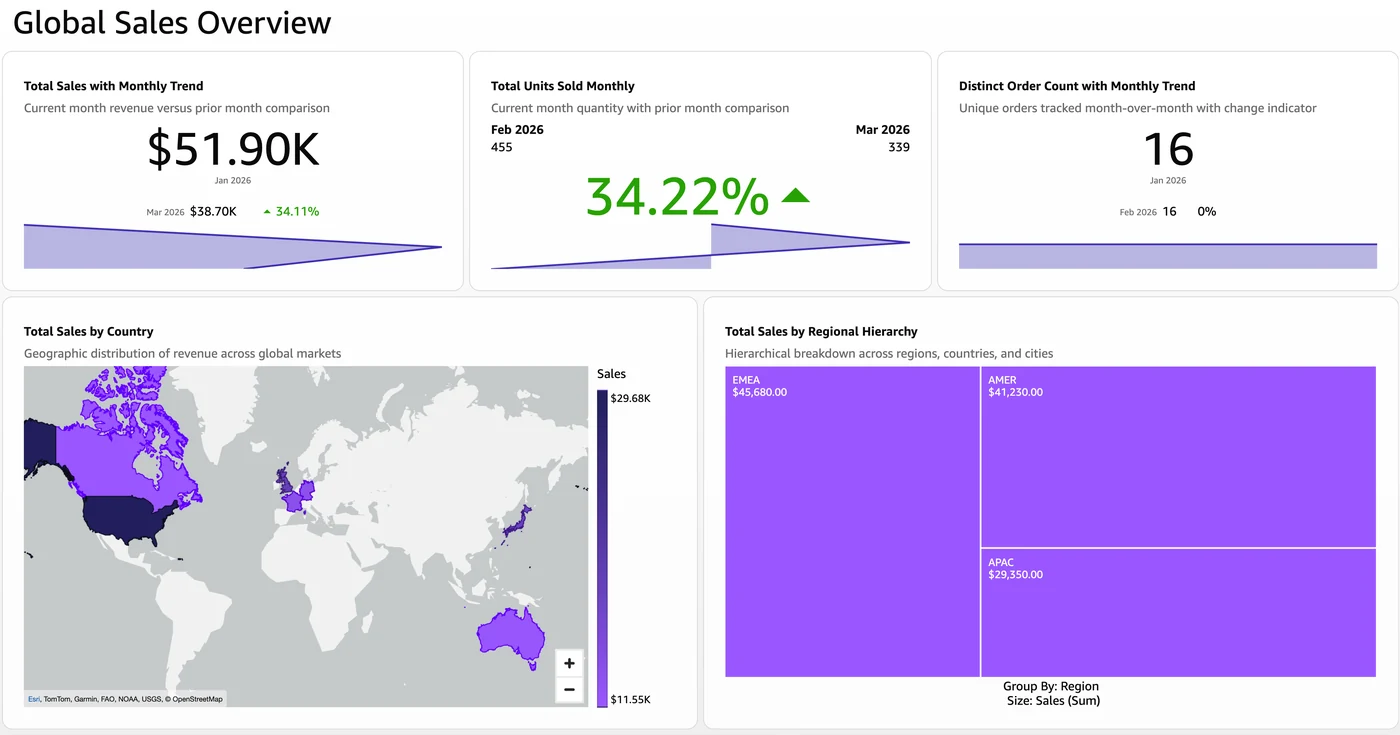
Amazon QuickSight has announced the release of a new hierarchy filter feature designed to improve how users interact with complex data dashboards. As a fully managed, cloud-native business intelligence capability, Amazon QuickSight allows organizations to build and publish interactive dashboards that can be accessed from any device or embedded into external applications, portals, and websites. Further details are available from AWS Machine Learning Blog in the original source material.
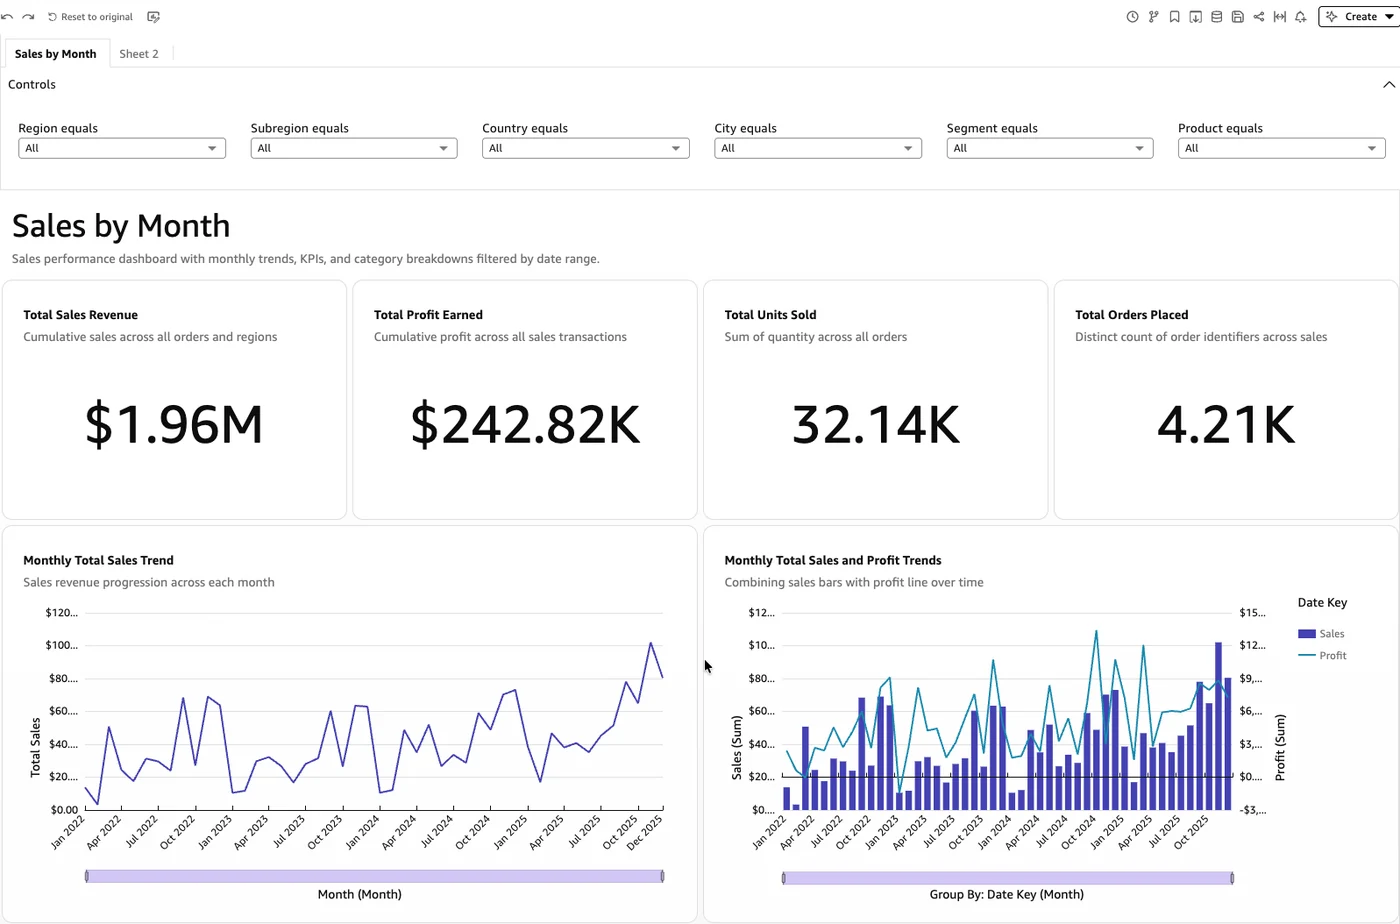
When building dashboards, authors typically add filters to let readers narrow down data for analysis. However, managing numerous independent filters can quickly clutter the user interface and demand multiple steps to apply changes. To address this challenge, dashboard developers can now utilize the newly introduced hierarchy filter option.
Key Benefits of the Hierarchy Filter
The newly released hierarchy filter provides several structural advantages for both dashboard authors and readers. By consolidating multiple dimensions into a single control, the feature significantly reduces visual clutter on the screen. Instead of displaying extensive lists upfront—such as hundreds of cities—readers are presented with a concise top-level list, such as regions, keeping the interface clean at every stage.
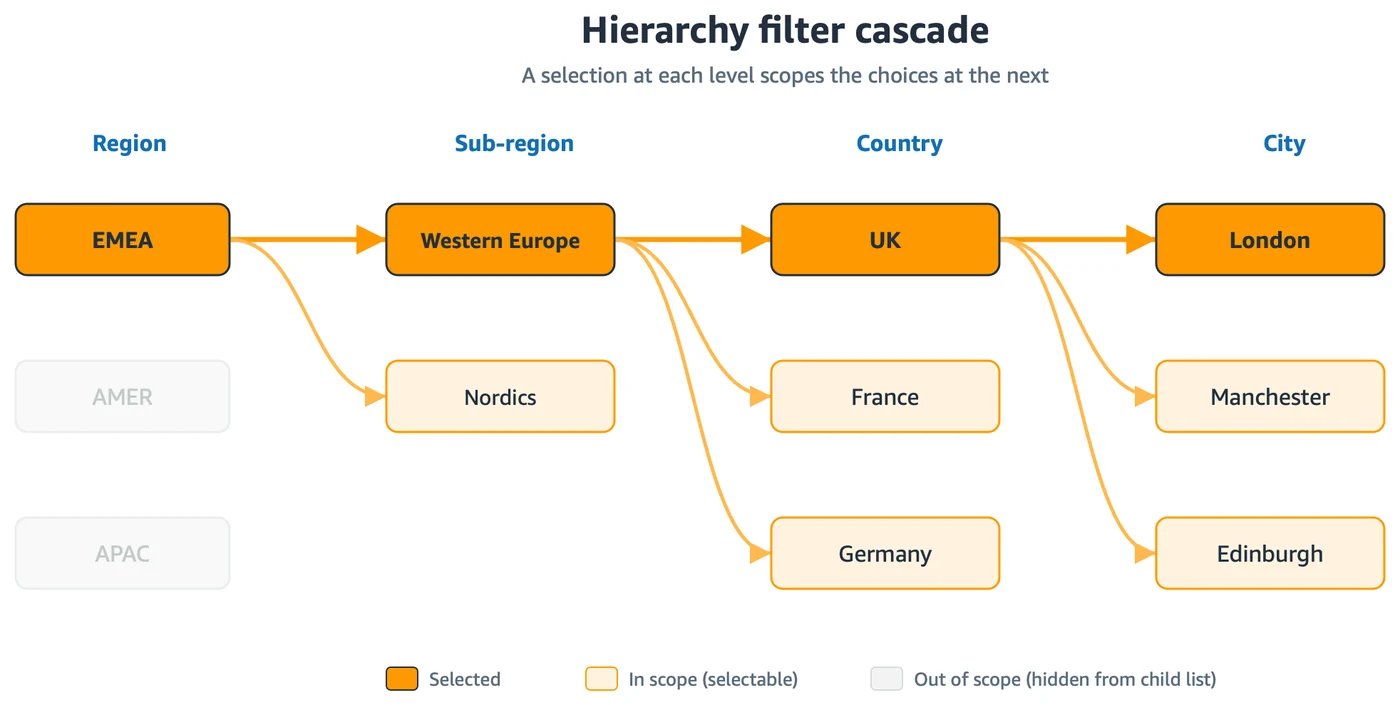
Additionally, the control establishes a guided exploration path. Readers drill down logically, such as moving from regions to sub-regions, countries, and finally cities. Because each selection dynamically scopes the available choices at subsequent levels, users reach their target data much faster without needing prior knowledge of geographical or categorical relationships.
The feature also accommodates flexible mix-and-match selections. Readers can combine various levels within a single control, allowing them to select an entire country alongside an individual city. Furthermore, the system scales smoothly to support deep hierarchies containing up to five levels without overwhelming the toolbar.
Configuring the Hierarchy Filter
Authors seeking to implement the feature can configure it directly inside the authoring environment. Within the Filters pane, authors select a field to filter and change the filter type to a hierarchy filter under the advanced options. This configuration allows up to five related fields—such as region, sub-region, country, and city, or product categories and product types—to be grouped into a single parent-child tree.
Once added, authors arrange the fields from broadest to most detailed using the move up and move down controls. Setting the scope to cross-sheet applications ensures that the single control governs the entire dashboard. Older standalone filters can then be removed and replaced by the unified hierarchy element.
The Reader Experience
From the perspective of the end-user, the hierarchy filter manifests as a streamlined menu control. When collapsed, it displays only the top-level categories equipped with expandable arrows. Expanding a specific node reveals the nested children below it, establishing clear contextual relationships.
When users select values at lower tiers of the hierarchy, the system automatically marks the parent chain accordingly. This automated selection behavior ensures that readers maintain full visibility of their scoping choices as they navigate through multi-layered business intelligence reports.
Sources
- AWS Machine Learning BlogSimplify dashboard drill-down with the Amazon Quick Sight hierarchy filter