
Cloudflare Redesigns Radar to Broaden Data Accessibility
Cloudflare has overhauled Radar to bridge technical depth with usability, making global internet trends more approachable for journalists, students, and everyday users.
 Radwan AbdulhadiEditor and technology writer

Expanding Radar Beyond Technical Experts
Since launching in 2020, Cloudflare Radar has provided a real-time view into global internet trends powered by Cloudflare's global network. Over the years, the platform naturally attracted expert users with technical backgrounds, such as network operators and academic researchers who rely on the service to observe industry trends and global events.
However, the platform also holds significant potential as a self-serve resource for journalists, human rights advocates, policymakers, and everyday users. To make the service approachable for these broader audiences while preserving its existing depth and rigor, the team re-evaluated the user experience.

Addressing Layout and Usability Challenges
The previous landing page successfully demonstrated the breadth of Radar's data, but the information presentation made it difficult to parse. The bento box layout gave all elements similar visual weight, vertical cards disrupted natural reading patterns, and the overall styling felt disconnected from Cloudflare's broader brand.
User feedback reinforced these concerns, with external users noting that the platform could feel intimidating to individuals encountering it for the first time. Achieving a more consistent experience helps signal that the service is an authoritative source while reducing the effort required to navigate complex information.
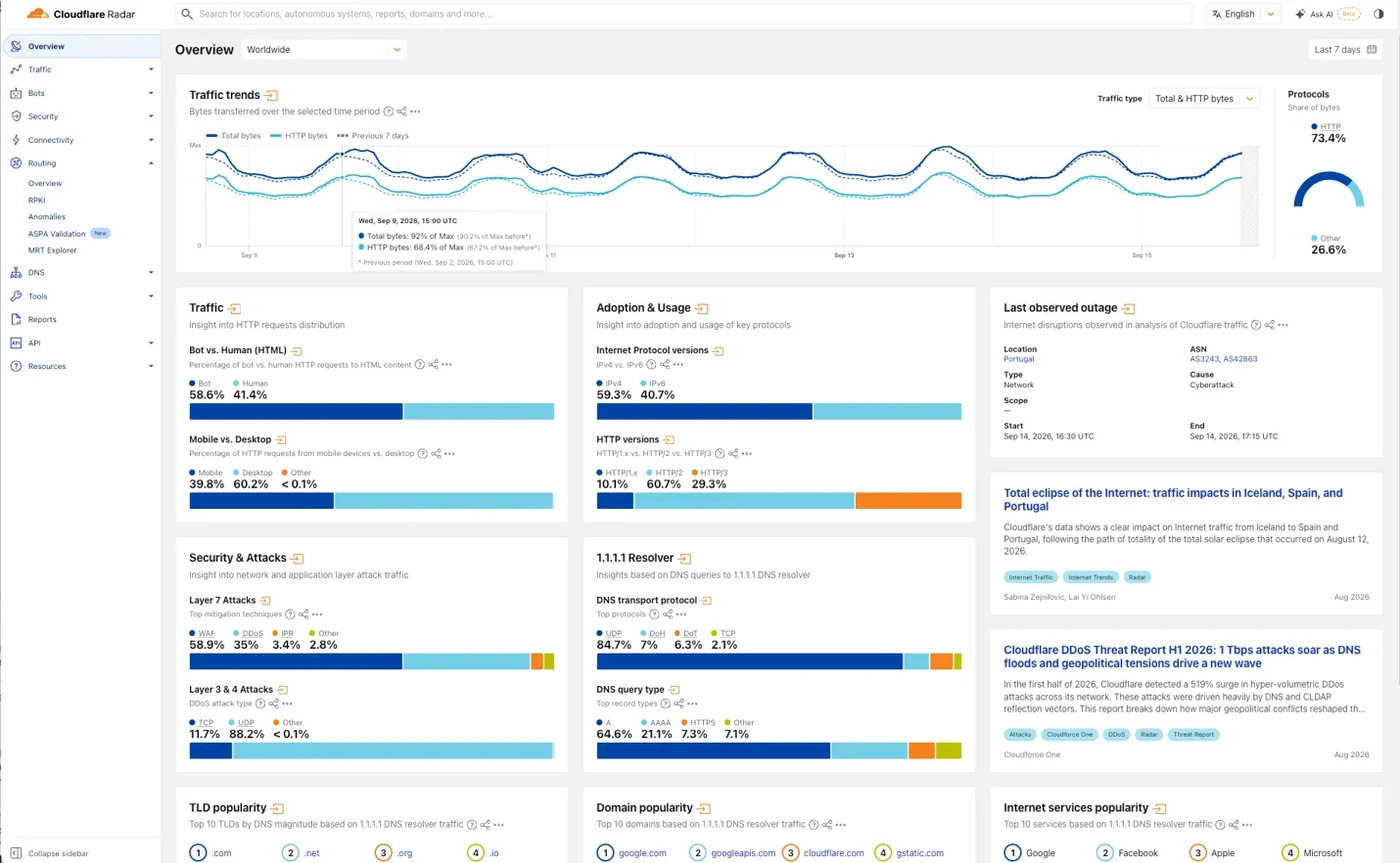
Introducing an Interactive Map and Tabbed Flow
The updated Radar utilizes a familiar visual reference for users of all backgrounds: a map. Although the internet operates largely outside national borders, its relevance to daily life is frequently understood through geography. The top section of the page focuses on traffic and outages, leading with outages because they represent concrete, timely, and salient data points.
Below the map, the former bento box chart widgets were transformed into a tabbed flow to help users navigate data more deliberately. These tabs supply summary statistics alongside calls to action for exploring data in depth, establishing a clearer hierarchy that prevents the page from feeling overwhelming.
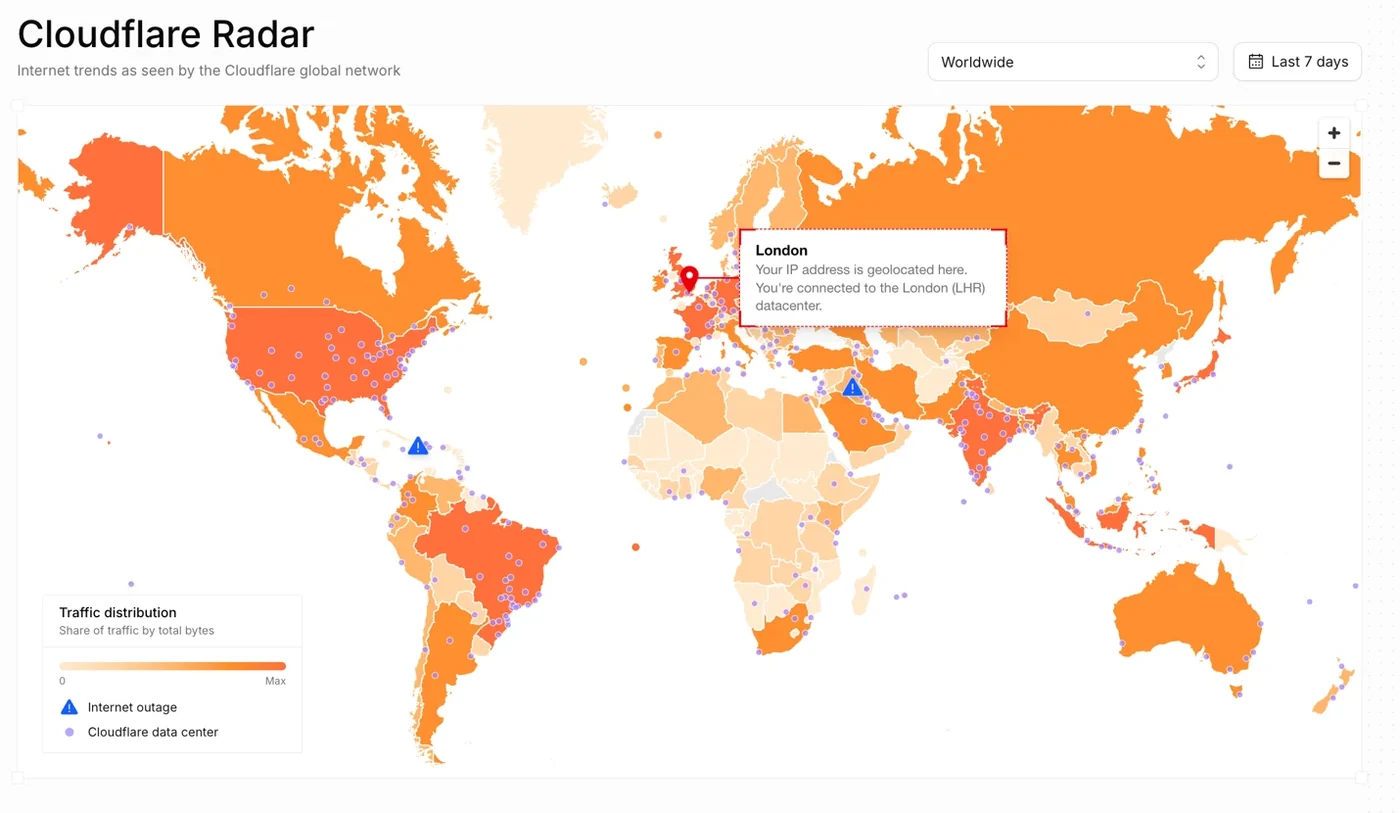
Aligning Design Language and Infrastructure
To develop a cohesive design language, the team evaluated Cloudflare's content ecosystem, balancing approachable marketing aspects with structured content and migrating to Kumo components utilized by Cloudflare's product system.
Iterating on the map required finding the right balance between data richness and approachability. Early iterations were overly dense with data-heavy visuals, while subsequent versions leaned too far toward static marketing styles. The final direction successfully captures the feel of live data while remaining easy to read.
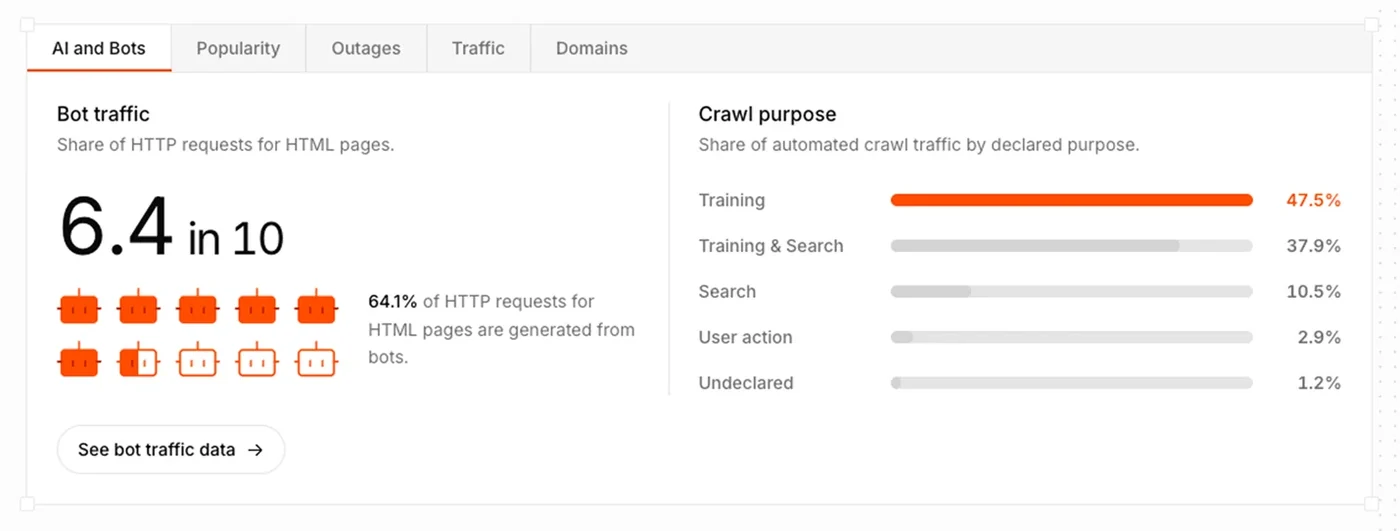
Future Outlook and Community Feedback
With Cloudflare sitting in front of roughly 20% of all web traffic, Radar continues to uncover unique insights across security, performance, and traffic. This redesign serves as a foundational step toward empowering users with real-time insights.
The team encourages users to share feedback on social media channels such as @CloudflareRadar on X or via email to help shape future platform enhancements.
Sources
- Cloudflare BlogBridging technical depth and usability: The story behind Radar’s redesign
Continue chronologically


Related entity coverage
Related stories
Inside Cloudflare Radar’s Redesign: Interactive Maps and Tabbed Data
Cloudflare has overhauled its Radar platform, introducing an interactive map and standardized components to make global Internet traffic data accessible.
Cloudflare Launches Zero Wire for Vulnerability Intelligence
Cloudflare has introduced Zero Wire, a public vulnerability intelligence feed on Cloudflare Radar designed to help security teams triage critical CVEs.

Cloudflare Radar Details Q3 2026 Internet Outages
Cloudflare Radar's Q3 2026 report reveals global Internet disruptions caused by power failures, natural disasters, and government-directed shutdowns.
Cloudflare adds continuous checks for Verified bots
Cloudflare is introducing ongoing checks to measure whether Verified bots follow robots.txt, HTTP 429 responses and other site preferences.